You may have seen a new tab at the top of your ads manager recently…

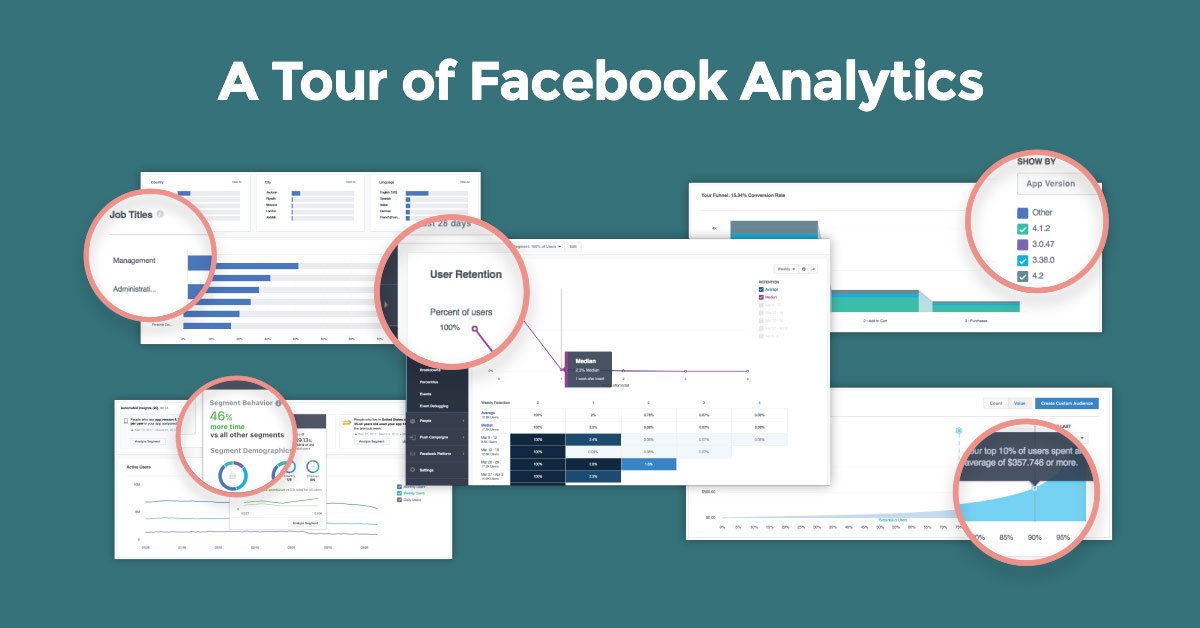
This is Facebook Analytics, a new measurement and reporting tool for Facebook Advertisers…

What is Facebook Analytics?
Actually it’s an update to an older tool app install advertisers may be familiar with, Facebook Analytics for Apps. Recently Facebook has updated the tool so it can be used for other advertisers besides mobile apps. In this post we’ll be giving you a firsthand tour of Facebook Analytics, what it tells you, what it can’t tell you, where it shines and where it falls short.
When you first visit business.facebook.com/analytics you’ll need to choose the pixel associated with your ad account, then you’ll be taken to the Overview dashboard screen.
After Facebook has had some time to pull your data, you’ll see a dashboard similiar to this:


By default, this Overview dashboard shows you total users over time with lines for daily, weekly and monthly trends, and some demographic overviews about where ages your users are most likely to be, what countries theyt’re most likely to be from, and what gender they’re like to be…
By default, this dashboard doesn’t give you a ton of actionable insights, but if you change the segment of users at the top of your page:

You can get the same metrics for people who have purchased, assuming you have standard events setup. I reccomend taking a look at this overview dashboard for purchasers or leads if you have a smaller amount of traffic.
There are a few other reports worth mentioning in Facebook Analytics that you should take a look at.
Cohort Reports
You may have seen a previous post I wrote about Cohort Reports and what they mean for your business and your traffic.
If you need a refresher:
A cohort report shows the maturation of a specific subset of users over time.
In other words, cohort reports can show you how long it takes for leads to become buyers, or installs to become purchasers, or how your ltv increase over time, or how your RPUs increase over time…
If you click the dropdown under “Activity” on the left side of your screen, you’ll see the Cohort option. Once you click that, you’ll see a screen that will prompt you to create your first cohort report.
There are two common use cases that Facebook Analytics’ Cohort reports would be useful for
For Leadgen Advertisers Who Want To Know How Long It Takes Leads To Buy

If you’re a leadgen advertiser, you’ll want to choose lead event first, then purchases second. For this report to work, you’ll need to have set up standard events.
After you click apply you’ll see a report like this.

This report shows you the percentage of users who become buyers after the initial week of acquisition. You can change the report to show the percentage of users who become buyers day by day by clicking the dropdown in the top right of the report.
For Ecomm Advertisers Who Want To Know How Long It Take Site Visitors To Buy
For e-commerce advertisers who sell a product that isn’t an “impulse buy” you’ll want to take a look at the Facebook Analytics Cohort for Pageviews to Purchases. It’s the same process as I show above, just choose PageView as the first event, then purchases as the second event.
Facebook Analytics Funnel Reports
Funnel Reports in FB Analytics function similarly to cohort reports, you choose a series of standard events to represent each step in the funnel, and then it shows you a bar graph showing the number of users in each step of your funnel, and the conversion rate between each.

Building Your Own Dashboards in Facebook Analytics
One other feature of note is the ability to build custom Dashboards in Facebook Analytics.

Currently you can only add charts from the active users, revenue and events tabs in Facebook Analytics. This is pretty limiting in practice, meaning you can only add charts that show line graphs of the number of a specific event over time, avg. amount of those events per user, and unique number of purchasers. You also can’t pull in spend numbers, static metrics, conversion rate metrics, roas metrics, or any of the normal performance numbers you would look at.
FunnelDash Gives You The Metrics You Need To Make Real Decisions
While Facebook Analytics does provide some useful information in the form of cohort reports, you’ll need more info to make real decisions on your Facebook Ad Campaigns.
Facebook Analytics falls short in key areas:
- No Ability to Pull in Spend Data into Custom Dashboards
- Only able to add charts for number of standard events
- Only able to use standard events for reports
- No ROAS metrics
- No ability to customize your own tables
- Metrics have no connection to ads, adsets, or campaigns in your account
FunnelDash on the other hand, comes with pre-designed, easy to set up performance dashboards that even the newest advertiser can start using quickly and easily.
Easily add one of our Five Template Dashboards with the click of a button.
Add our Prospecting Dashboard, set you campaign name filter with a few clicks,
(Click the gear icon in the top left, and add a campaign name filter for “Prospecting”, assuming all of your cold traffic campaigns have Prospecting in the name)
And you instantly have a clear and concise view of how your cold traffic is performing.

Unlike Facebook Analytics, FunnelDash’s 5 Core Template Dashboards give you key metrics like Ad Spend (labeled AS), ROAS (Return On Adspend), Conversion Rate (labeled lead event conversion rate or LECR on the dashboards).
In addition FunnelDash’s 5 Core Dashboards allow you to customize your tables, and view different table breakdowns and columsn with performance in mind.
Facebook Analytics only shows you the totals associated with certain standard events, how many users of a certain age became a lead, or a customer…

FunnelDash, on the other hand, gives you the performance context you need to take action to improve your campaigns. What use is knowing the number of leads that came from 25-34 without knowing the cost associated with acquiring those leads, without knowing the return associated with those leads. Here is FunnelDash’s Audience Audit Dashboard in action:

Using custom conversions instead of standard events? No problem, our dashboards allow you to add, edit and remove different metrics and still get a clear view of what’s working. Just click the three dots in the corner of the table to add or remove metrics on the table.
Want to Learn More About How Our Dashboards Can Help You Grow Your Agency?
Try FunnelDash free for 14 days and see how easy it makes your campaign analysis and client reporting. Click on the button below to start your trial now.
