Facebook Ads Manager is fantastic for managing ads. Their interface is great and gives you all the options you need to get into their system and create ads that boost your clients’ ROI.
It’s not so great for managing clients.
As we’ve mentioned before on the FunnelDash Blog, Facebook Ads Manager is lousy when it comes to creating Facebook ad reports for clients.
It offers too many choices. It’s hard to find the data that matters to your clients. Most importantly, it takes forever to create Facebook ad reports that make any sense to your clients, based on the information you can pull from Facebook Ads Manager.
It’s hard to track key performance indicators (KPIs), see trends or get all the information you need for your clients all in one place.
There are times you want to show your clients different aspects of their campaigns. To do that in Facebook Ads Manager, you’d have to pull several reports and combine the information via pivot tables to get the information you’re looking for.
What’s more, you wouldn’t show a prospective client the same information you would show a client you’ve been working with for a long time. Which means you’d have to put in extra work to pull an audit report for a new client.
What you really need is a Facebook ad client management system, so you can see exactly what’s going on with each of your clients, at a glance, track their metrics over time and give them weekly or bi-weekly reports on their campaigns.
More...
Here at FunnelDash, we’ve created that client management system and we’ve made it easy to pull and create as many Facebook ad reports as you need for each of your clients every month.
This does more than just make your life easier. It saves you time, effort, stress, and money. Plus, it’s easier to see trends in your clients’ campaigns over time and compare those metrics to your clients’ goals, to make sure you’re staying in line with what they want to accomplish.
It also builds trust between you and your clients and makes them more likely to remain your clients for a long time to come.
I’d like to share with you the 6 Facebook ad reports our agency has found most useful in client reporting and long-term relationship building.
Setting them up in FunnelDash only takes a few minutes. Then you have a standard template you can use every month and adjust as necessary to suit each client’s reporting requirements.
Instead of having to pull Facebook Ads Manager reports and manipulate the data to get the information your clients want, these report templates automatically pull the information from you Facebook ad account and present it in a ready-to-use format.
To use these reports for your own agency, you must have a FunnelDash account. You can get started with a 14-day free trial here.
Once you’ve logged into your FunnelDash account, you’ll need to know…
Where to Find the Reports
The first place you’ll want to visit is the Dashboards section, which is what comes up when you enter the FunnelDash app. Click on the bright red "Create Dashboard" button on the left side of the app window.
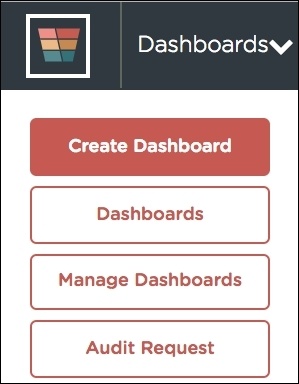
You'll see the Create an Audit screen, as shown below.
Please note: There is a difference between an audit, which is usually used for a prospective client, and a report, which is usually used for a current client. We put them in the same place so as not to confuse the issue.
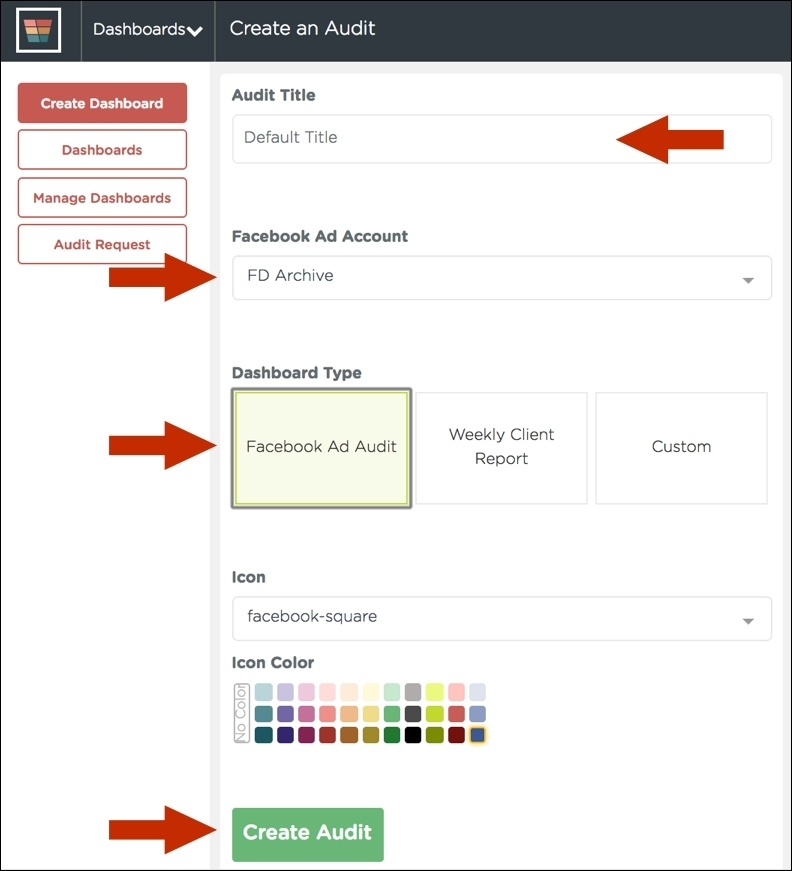
First, name your audit or report.
Then choose the account you want to audit or report on.
Choose whether you’d like to generate an audit or a weekly report, or customize your own report.
If you would like to choose an icon to represent this particular report, you can choose it from the Icon dropdown menu. You can change the color of the icon to color code your reports by type or by client.
You use audits to show a prospective client how their campaigns are performing right now and what you would do to improve that performance.
You use weekly and custom reports to manage clients’ campaigns and show them the results you’ve achieved for them.
We have two standard dashboards that you can create with the click of a button, the Facebook Ad Audit and the Weekly Client Report. You can use the Custom button to create any of the reports listed below, or any other report that helps you make sense of your clients' data.
Audits and reports are made up of standalone cards, charts and tables.
Each of these is customizable so you can choose what you want your audit or report to display. To do this, click on the gear icon at the upper right corner of the card, chart or table and choose the settings for the information you want to appear.
Card Settings
Each card type has features you can use to track your clients’ campaigns more efficiently. Some of the features are available in all of the cards, some are specific to the card type.
Stand Alone Cards
This card type has all the basic features.
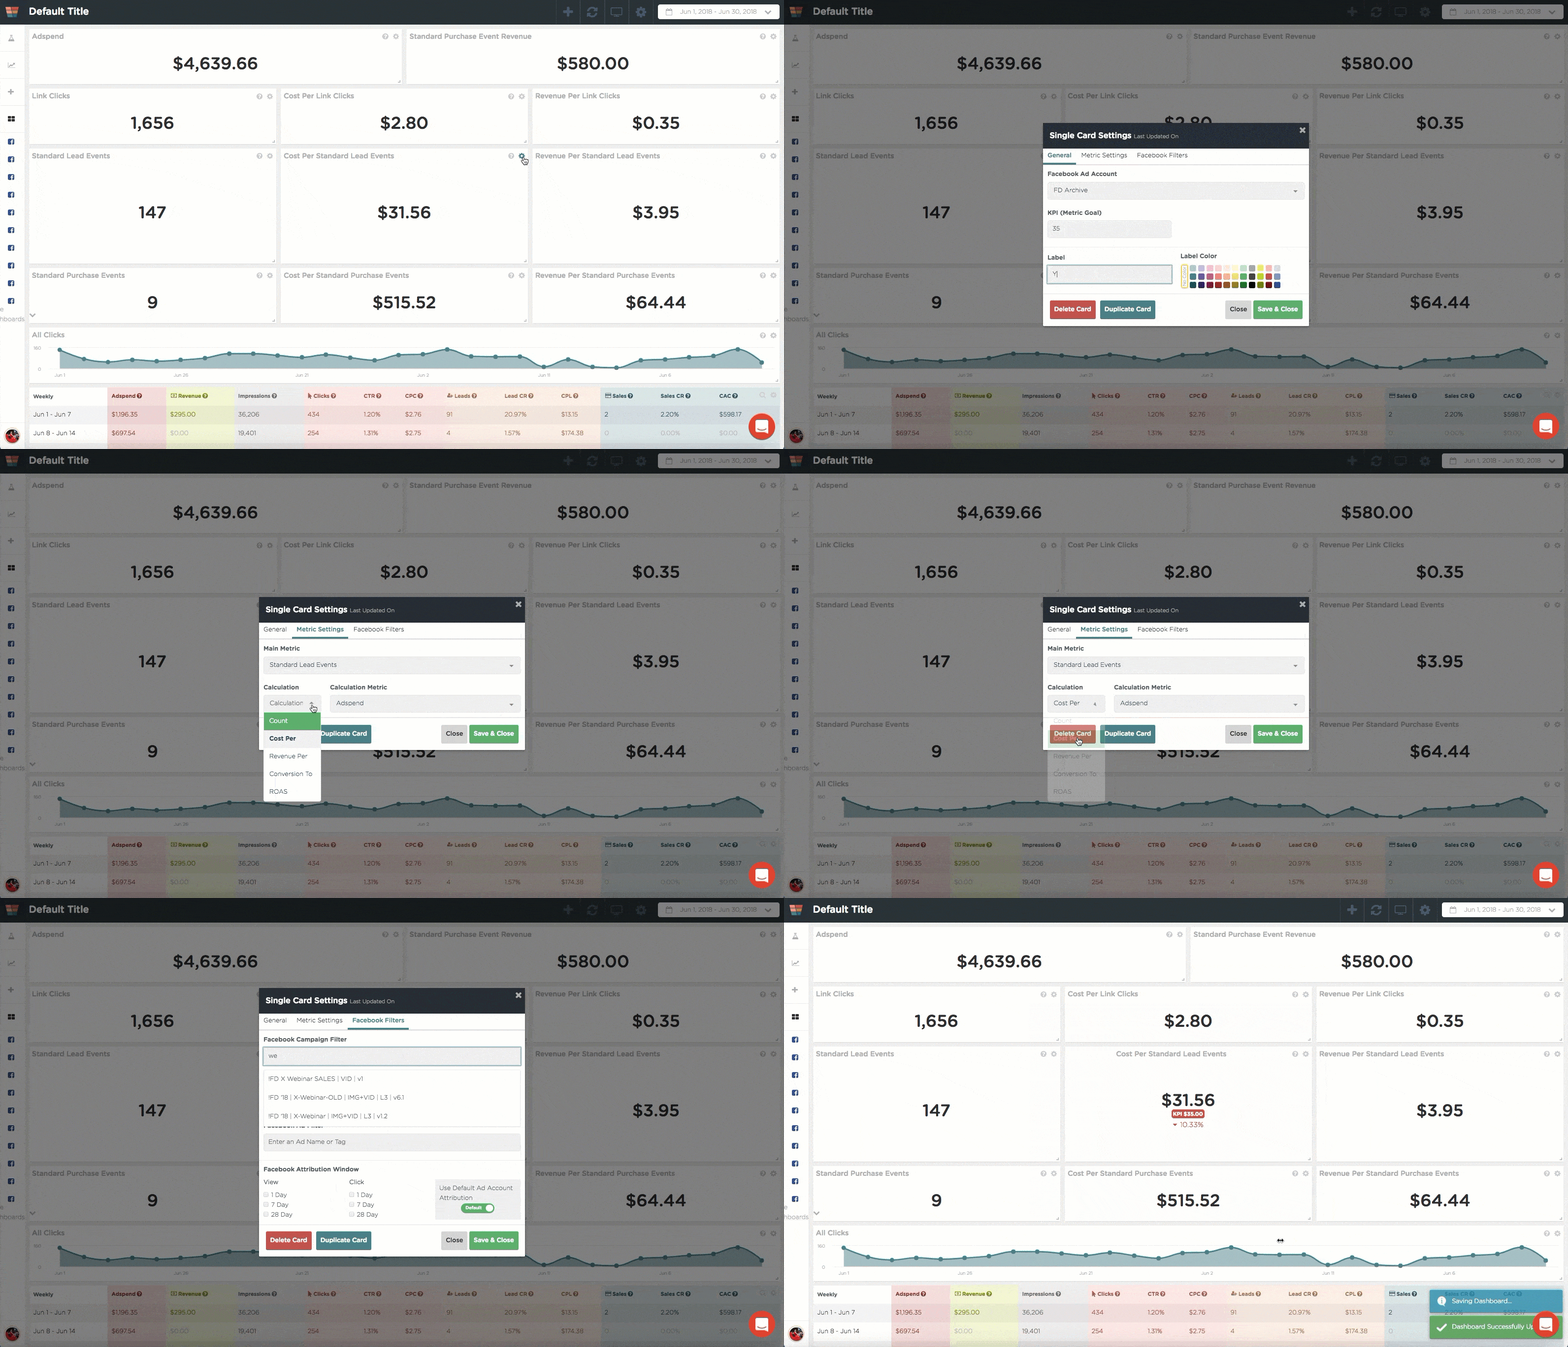
In the General settings tab, you can:
- Change the account you’re tracking on that card.
- Add a KPI to track where you are in terms of your clients’ goals. (If the KPI has gone up, it will be green, if it has gone down, it will be red.)
- Add a label to the card to make it easier to review at a glance.
This allows you to set up the card so you have an “at a glance” view that shows you what’s going on at that moment, the goal you’re trying to reach and which client, campaign, adset, ad (or other label of your choice) you’re looking at.
In the Metrics settings tab, you can:
- Change the main metric you are tracking on that card.
- Change how that metric is calculated, including by:
- Count
- Cost Per
- Revenue Per
- Conversion To
- ROAS
- Change the calculation metric. Depending on the calculation type you choose, you’ll see different options on how to calculate the metric.
This lets you get very specific on the types of metrics you want to track. It’s also a lot easier to get to this information on a card than in a spreadsheet.
In the Facebook Filters setting tab you can choose to filter your card by:
- Campaign
- Adset
- Ad
This feature enables you to drill down into your results quickly and easily, instead of sorting through a lot of data to get this information.
Charts
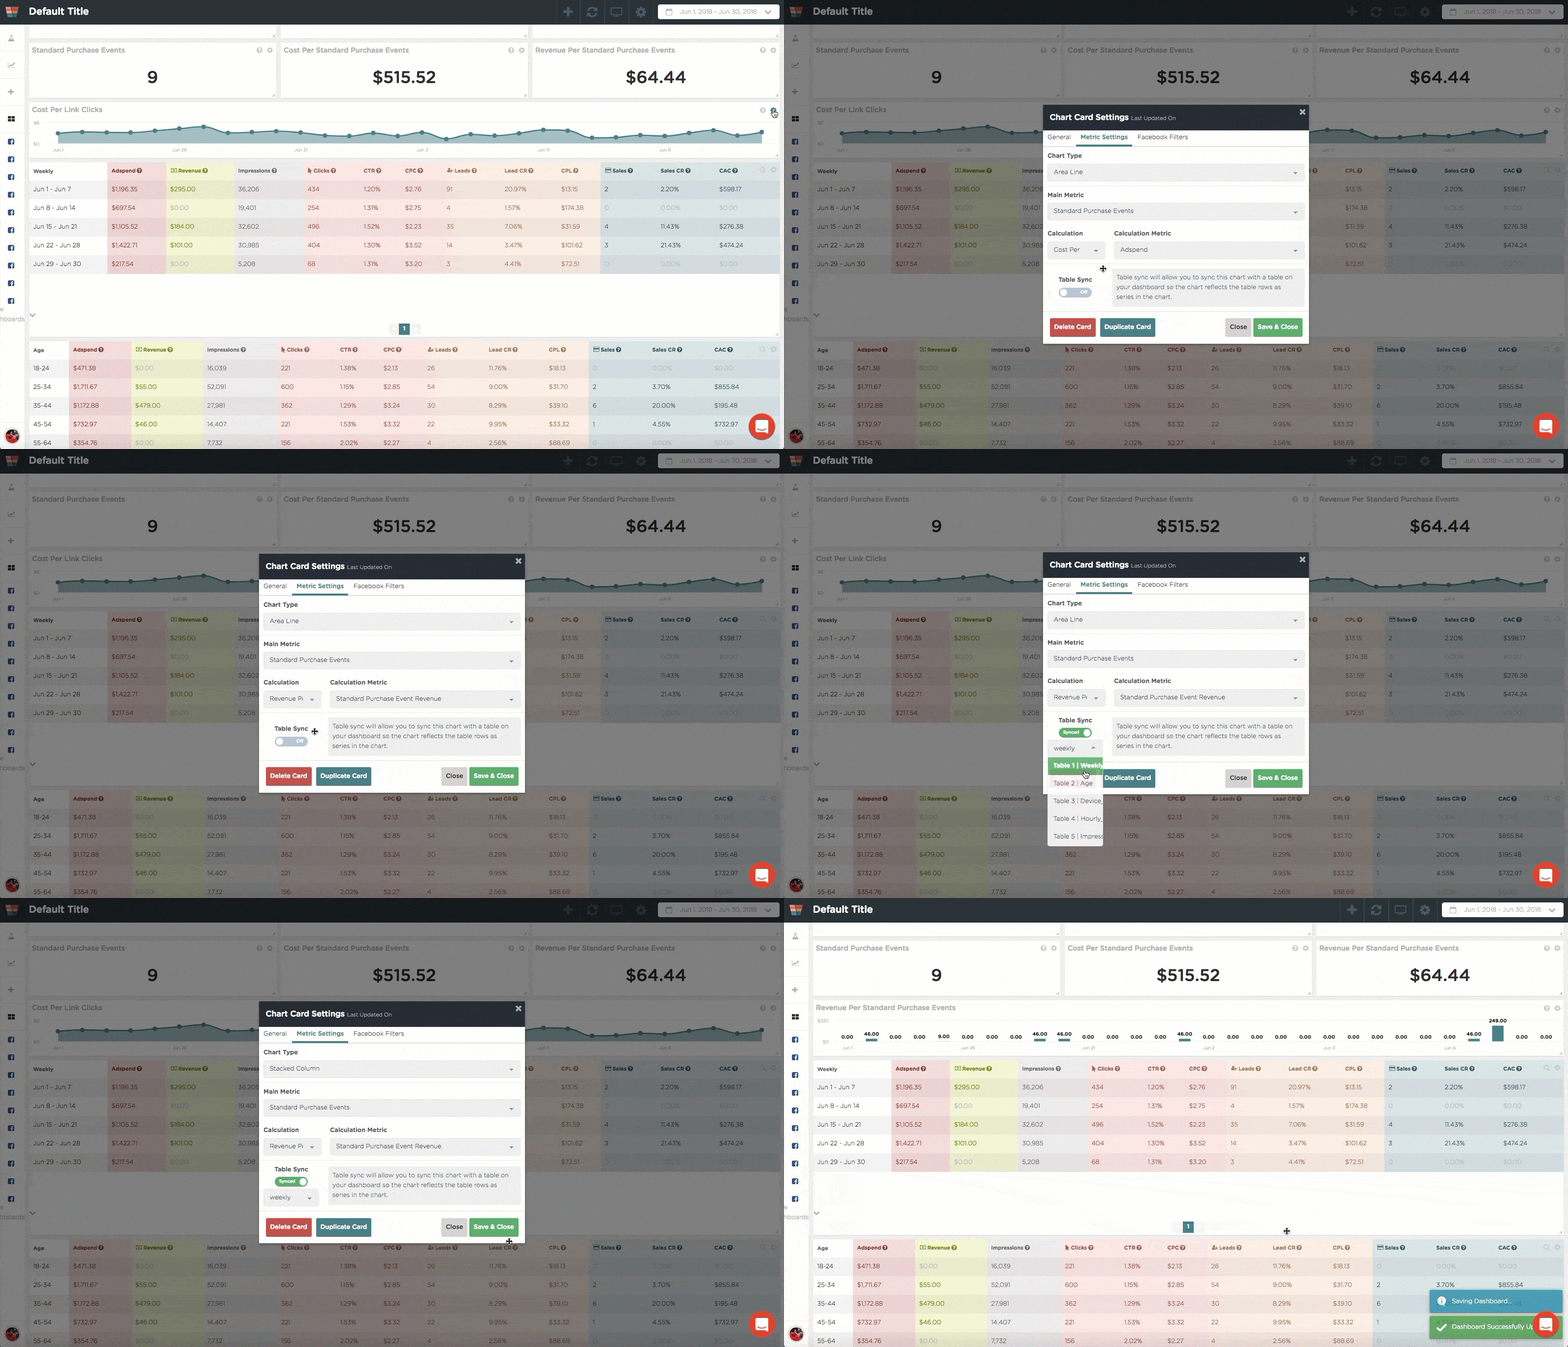
The chart cards include the same settings as a stand alone card, with the added benefit of being able to customize your chart to display the metrics you want in the visual method that’s easiest for you and your clients to interpret.
To change these metrics, click on the Metrics settings tab. You can change:
- The chart type, including:
- Line
- Area Line
- Bar
- Column
- The main metric
- The calculation type
- The calculation metric – As with the stand alone card, the calculation metrics available will be determined by the calculation type.
With the chart cards, you can sync them to any one of the tables below so the chart reflects that table rows as a series on the chart.
To do this, slide the Table Sync button to “On” and choose which table you’d like the chart to sync with. This feature also gives you two additional chart types, Stacked Bar and Stacked Column.
Tables
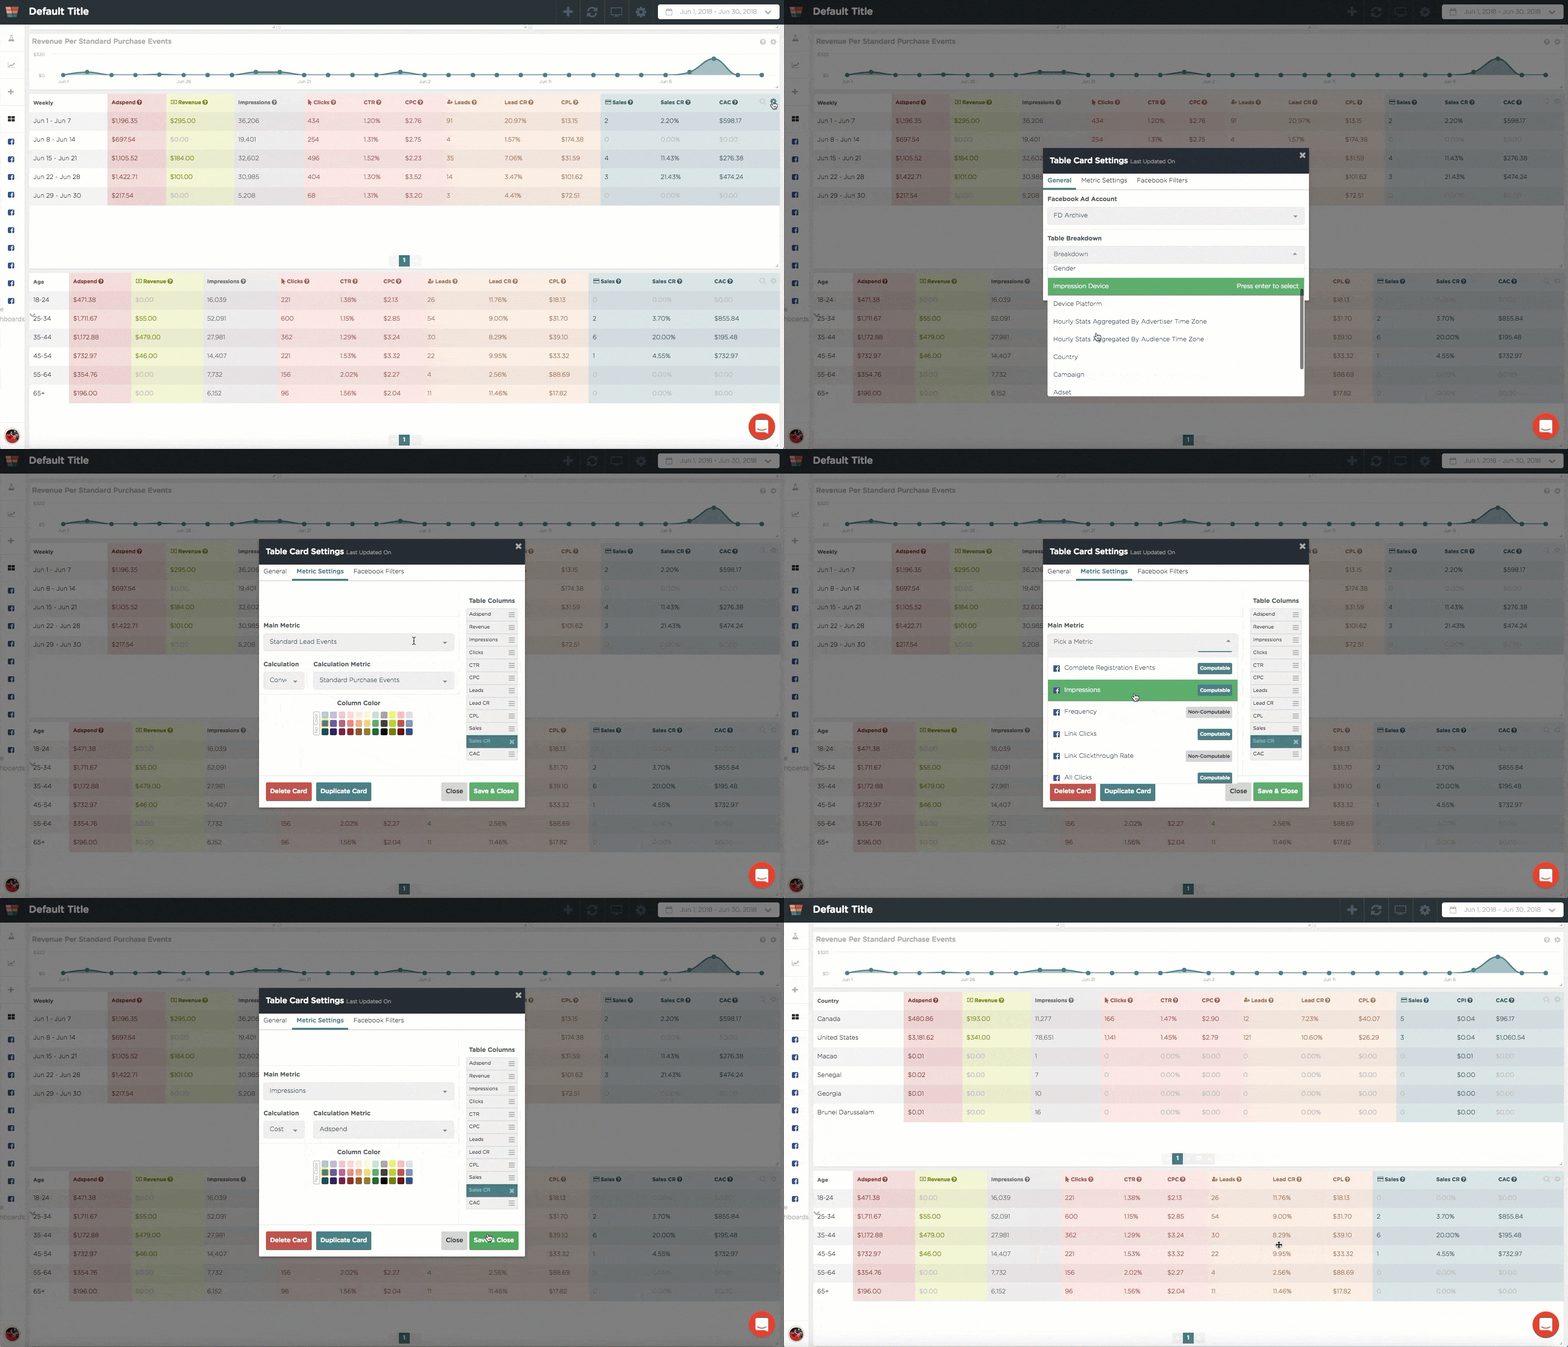
The table cards display several metrics according to a specific breakdown, including:
- Week
- Age
- Gender
- Impression Device
- Device Platform
- Hourly Stats
- Campaign
- Ad Set
- Ad
- Product ID (for Ecommerce companies)
The breakdowns delve into each metric so you can see how your clients’ campaigns are performing according to that breakdown. This gives you valuable information on audience response and lets you tweak campaigns, that need a little help or shut off the ones that aren’t performing.
You can drill down into the ad sets and individual ads by using the Facebook Filters settings tab to specify what you want to see. This will allow you to determine what is and isn’t working, so you can scale your clients’ successful ads, faster.
Plus, on the table card, you can customize the individual metrics displayed on the table to track whatever you and your clients feel are most important.
Note Cards
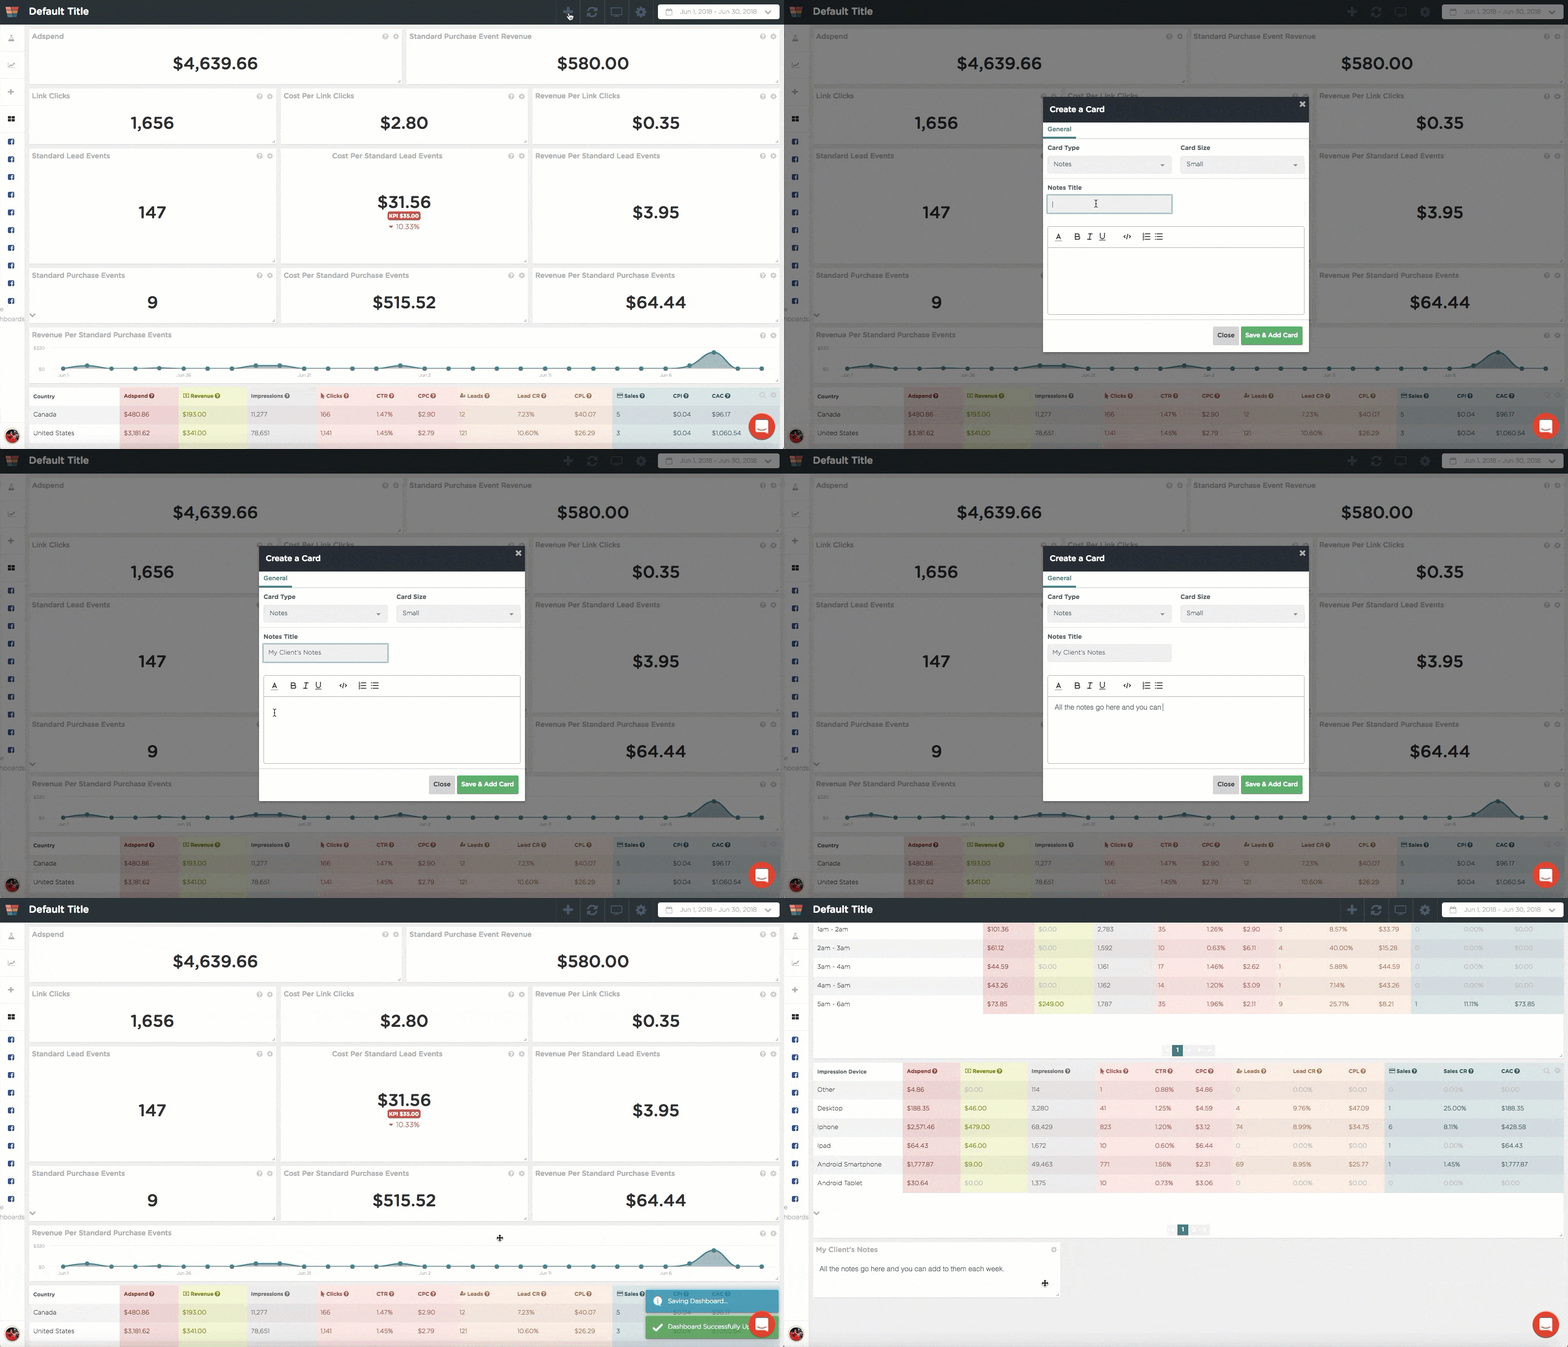
This is a specific type of stand alone card that allows you to leave notes for your clients so they know exactly what’s going on every week. Use this instead of creating an additional document so your client doesn’t have to flip between the report and the document. You can update the notes each week, adding to the record of what you’ve done during the campaign.
To change the account you’re tracking with any given dashboard, click on the gear icon in the upper right-hand corner, next to the date range. Then use the dropdown menu to choose your preferred account.
The best part about this system? To create your Facebook ad reports each week, just take a screenshot of the appropriate dashboard (or dashboards) and send them to your clients.
It’s that easy.
Depending on your subscription plan, you’ll get a certain number of dashboards. However, you can switch between client accounts to see the information you’re looking for. This gives you the ability to have multiple clients with a “limited” number of dashboards.
You will want to create one of each of these dashboards when you first open your FunnelDash account. That way, you’ll be able to see how each of them work and customize them, so you can use them to create Facebook ad reports for your clients, starting with…
The Client Onboarding Dashboard
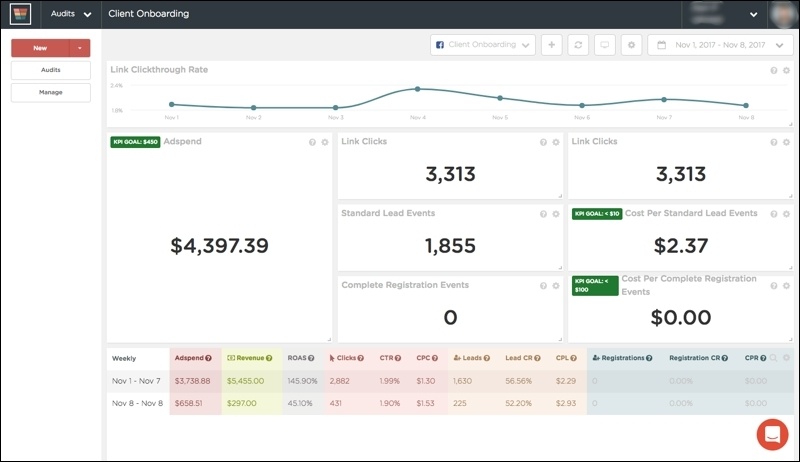
Also referred to as the Client Setup Dashboard in our Quick Start Course, this is the dashboard you’ll build with your new client when you meet with them for the first time after they’ve signed a contract with you.
You’ll go through a series of questions with them, many of which will determine how you run their ads, but others will include information you’ll need to keep track of progress, like:
- What is your target daily spend, and max spend?
- What is your target Return on Spend within 30 days?
- What is your target cost per lead (CPL)?
- What is your target cost per customer (CPC)?
Again, refer to the Quick Start Course to get the full list of questions.
When you set up your Client Onboarding Dashboard, you’ll customize it to include all of the metrics your client wants to know.
This helps you set a baseline as you move forward with the campaign.
Keep this date range static because it will give you something to compare to as time goes on, so you can show your client where they were when they started with you and where they are now that you’ve been running their campaign for a few months. (Which of course will be doing much better than when they joined your agency.)
Now that you’ve got your baseline, you’ll want to set up the Facebook ad reports you send every week.
The Facebook Weekly Dashboard
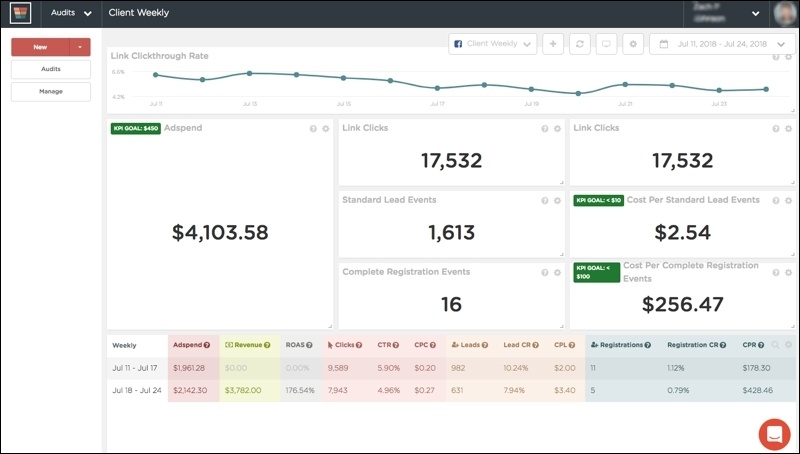
This will be the Facebook ad report you refer to most often. It’s designed to give you a “quick glance” overview of what’s going on with your clients’ Facebook campaigns.
The first thing most clients want to see is their ad spend, leads, cost per lead, sales and cost per sale. In this image, I’ve set the date range for the last 14 days, so you can see the results from the past 2 weeks. You'll note it matches the Client Onboarding report above in terms of the amount of time displayed. This is so your client has some measure of comparison.
The chart above the table shows you the ad spend for the same date range. You can see that we started off with a high ad spend at the beginning of July, then let it drop off as our promo ran down.
You can color code each metric to make them easier to find at a glance, like I did above.
You can give your client a basic overview of every campaign you’re running for them with this dashboard, or you can drill down into each specific campaign, so they know exactly what is going on at a campaign-specific level.
This gives you the advantage of being able to answer broad and campaign-level questions without having to sort through data for hours. It makes managing your clients’ campaigns much easier and gives you more time to take on additional clients or just enjoy your life.
Speaking of additional clients, you’ll want to set up this next dashboard to get more of them.
The Facebook Audience Audit Dashboard
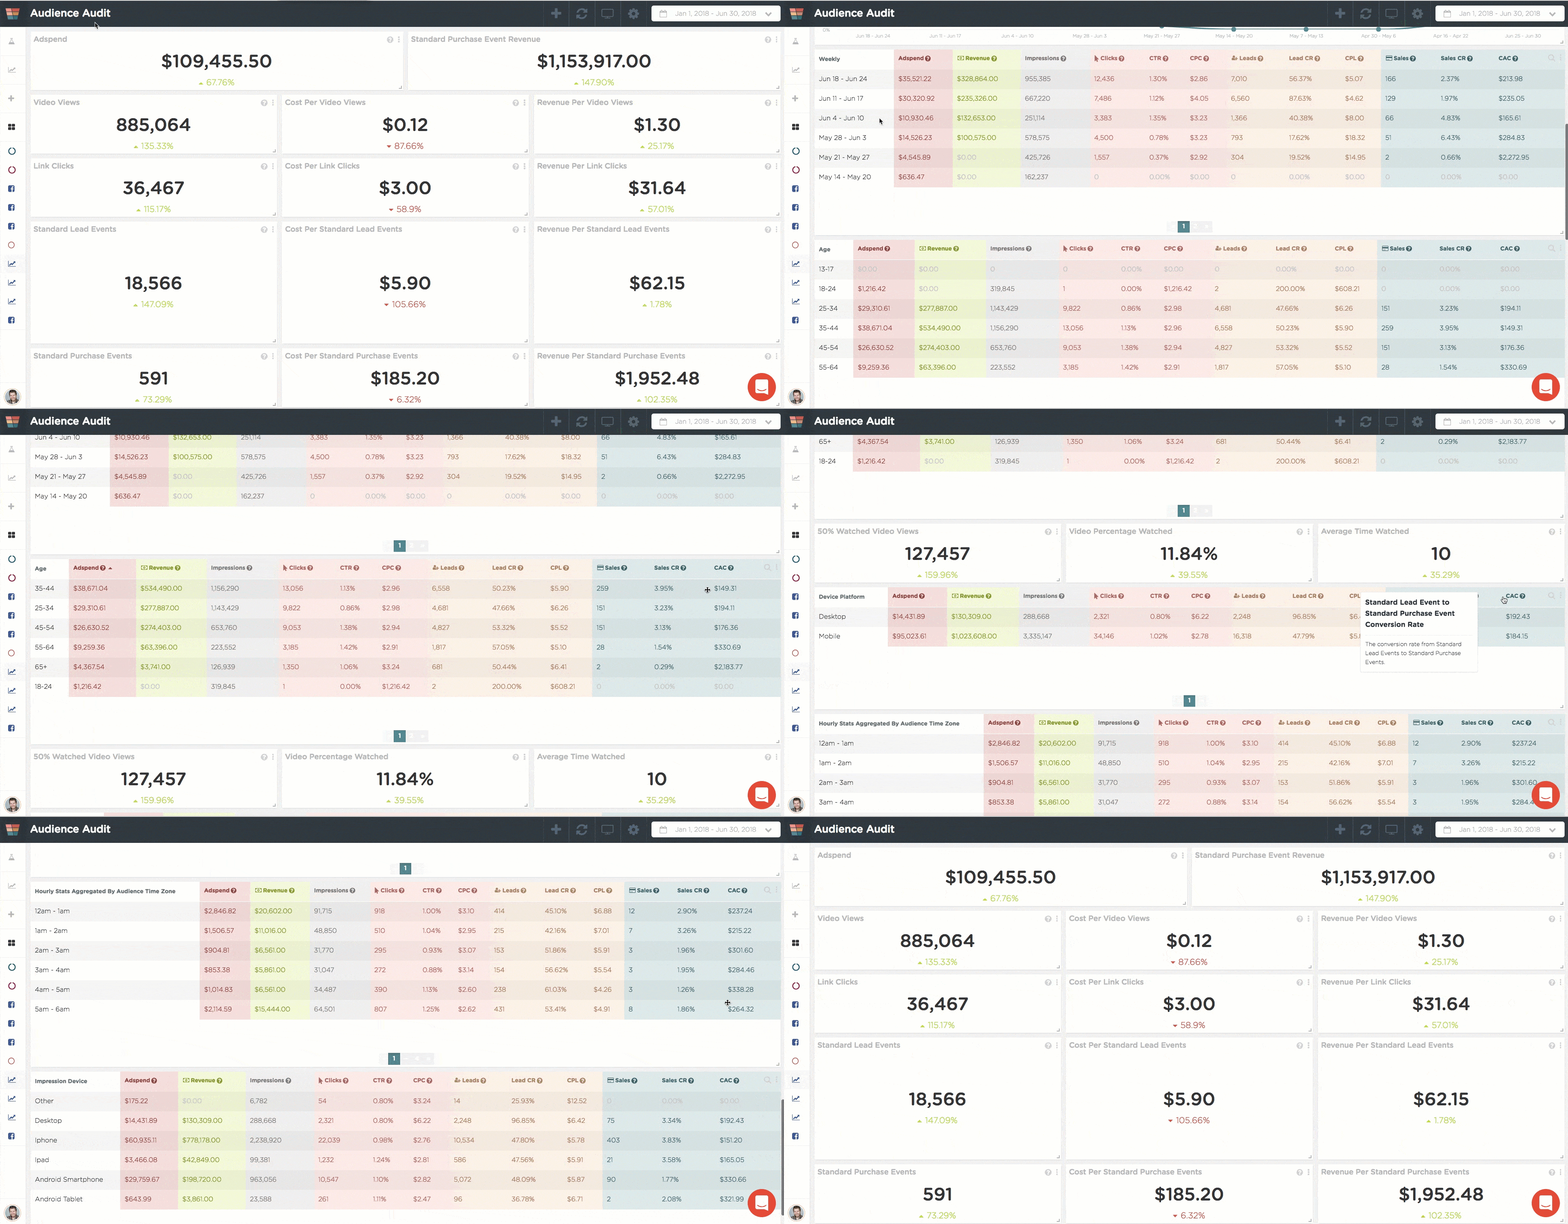
You’re likely to use the Facebook Audience Audit dashboard a lot as a digital marketing agency owner. It’s perfect for showing a prospective client exactly how you’ll help them get a better ROI and grow their bottom line.
It’s also a great way to send them Facebook ad reports to remind them of how you’ll help grow their businesses.
You can use this dashboard in a couple of ways. First, you’ll use it during your initial audit to give a high-level overview of where your client is right now and what you can do to improve their campaigns overall.
Next, this is a great dashboard to use when you want to drill down into a campaign’s demographics to see which audiences you should use when you’re ready to scale.
You can do this during an initial audit, just to demonstrate how you’ll use your prospective client’s data to improve their campaigns, instead of making “educated guesses.” You can also use it as part of your regular campaign maintenance to see exactly which ads and audiences are performing well and which should be either turned off or have their ad spend reduced.
You can see from the image above that the cards on the right side of the dashboard give you the most important metrics from your Facebook Ads account. Again, you can change any of these metrics so you’re seeing the ones that matter most to you.
The chart on this dashboard is set to sync with the table below it to reflect the data in the table rows. This is a feature you can turn on or off in any FunnelDash dashboard.
If you want to dig even deeper, I recommend this post on finding the most profitable “secret” audience segments, and this post on identifying current issues with current Facebook ad campaigns.
Meanwhile, it’s time to move on to the nitty-gritty of Facebook ad reports, testing your creative.
The Creative Performance Report
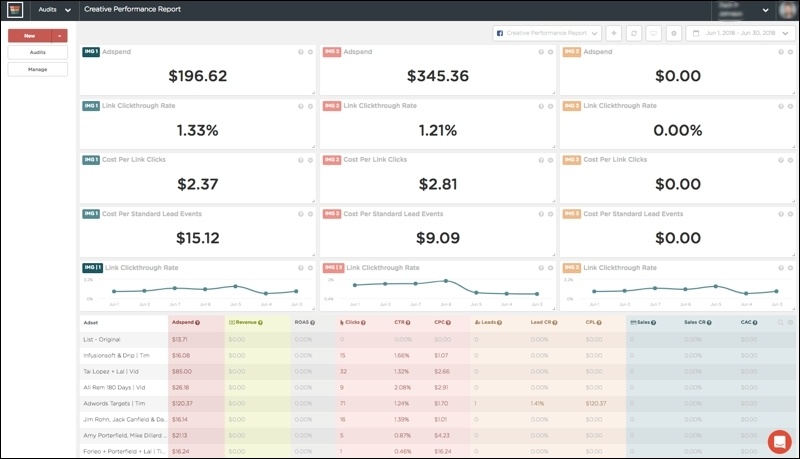
This is where the rubber meets the road, in terms of showing your clients how you’re increasing their ROI.
This dashboard helps you narrow down your winning ads, so you know what to scale, with which audiences and when. You can track 3 ads, ad sets or ad campaigns, depending on what level you want to measure. We recommend testing ads, as you’ll get results faster with a tighter focus.
You’ll want to look for the creative that’s working best to get your clients the highest ROI (meaning leads and sales) not just getting the cheapest clicks. They’re not always the same and you want to make sure you’re scaling the ads that work best, not just the ones that cost the least.
You can set up your test to track whatever metrics are important to you. Each card can be customized to your testing needs, according to the list below.
You’ll go through a 4-week testing cycle to discover your winning ad. You’ll test as follows:
- Week 1: You’ll test ad types, such as video, image and carousel.
- Week 2: You’ll test images.
- Week 3: You’ll test copy. (You can do these two weeks in either order, just make sure you do one, then the other.)
- Week 4: You’ll see an emerging control. You can continue to test other variables if you wish.
For more details on the how to run Facebook ads tests, check out this post.
If you want more details on how to use the Creative Performance Report, I recommend this post.
These are the perfect Facebook ad reports to show to the designers and copywriters working on your clients’ campaigns (whether they’re part of your agency or work directly with your clients) as well as your clients themselves.
That way everyone can see what’s working, how well it’s working, and you can determine how to make the tweaks that will improve performance and increase ROI.
There is one more dashboard I strongly recommend you set up right away. And this one matters the most to you, because it’s:
The All Clients Report
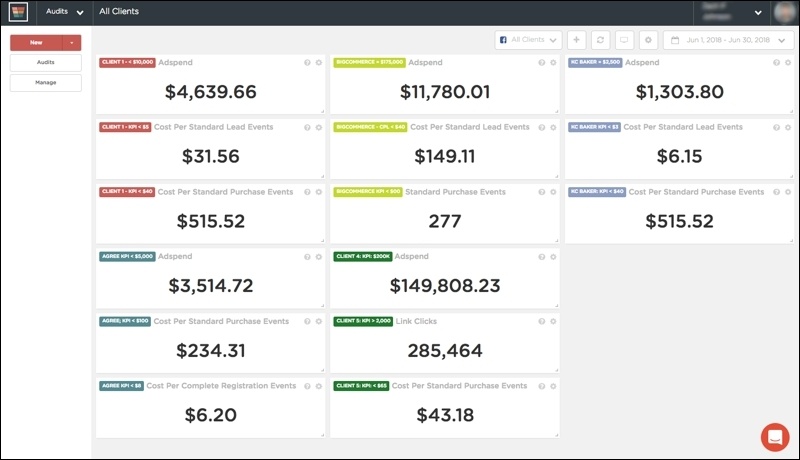
Yes, we’ve created a Facebook ad report exclusively for you, the agency owner.
Why? Because whether you’re the person running each campaign or you’re relying on Facebook campaign managers to do it all for you, you want to keep track of each client’s campaign performance on a daily and weekly basis.
In fact, we refer to this as the Agency Owner dashboard in the Quick Start Course. We believe this particular dashboard is crucial to keeping your agency solvent. The sooner you know about problems with a particular client, the faster you and your team can work to fix them.
This saves you and your clients money, proves your worth as an agency and makes your clients want to stick around for a long time to come.
This particular dashboard is made up solely of cards. The idea is to give you a snapshot of each client in one place instead of having to go through each client’s information every day.
If there are problems, you’ll already have your other dashboards set up, so you can identify and correct the issues quickly. Again, we’re all about saving you time so you can grow your business and enjoy your life.
For each of your clients, you will create a set of 3 cards that track the following metrics:
- Ad spend
- Cost per Lead (also known as Cost per Standard Lead Events)
- Cost per Sale (also known as Cost per Standard Purchase Events)
These three metrics will give you a high-level overview for each client that will keep you up to date and prevent you from driving your campaign managers nuts with requests for information on how client campaigns are doing.
You can add more metrics to each set of client cards if you want to, but these 3 are your baseline.
Now, I’m going to preview one more of our fabulous Facebook ad reports for you.
The Facebook Messenger Ads Report
We promised you 6 Facebook ad reports. This is the final one, and you should be using it for your own agency.
You already know you need to run Facebook Messenger ad campaigns to grow your list of leads and increase your client base.
The problem with Facebook Ads Manager is, you can’t figure out the cost per Facebook Messenger subscriber. Nor can you figure out the cost per qualified Messenger subscriber or the cost per Messenger subscriber who makes it all the way through your bot sequence.
It only tells you the cost per message reply.
This does you no good when it comes to your own bottom line. You want to optimize your Facebook Messenger ad campaigns for cost per subscriber and cost per qualified subscriber, not just by cost per one-off reply.
FunnelDash will soon allow you to trigger custom pixel events based off Messenger keyword triggers across all of your bots. This will let you use Facebook’s event tracking to track and optimize your Messenger funnel performance.
Within the next couple of months, we’ll have all the metrics to track your Facebook Messenger campaigns available in your FunnelDash account.
We’ll do another blog post on this dashboard once it’s released, so you’ll know to look for it inside your FunnelDash account.
The best way to figure out which dashboards are most valuable to you, is to try FunnelDash, free for 14 days. That way you can explore the Facebook dashboards and see what each of them can do for your campaigns.
This will give you a chance to customize each dashboard to your needs, and even create multiple dashboards to track your campaigns, depending on which version of the free trial you use. (Please note: Once your free trial is up, your credit card will be charged an annual fee, according to the plan level you chose for your free trial.)
Once you start working with FunnelDash, you’ll quickly discover how much easier it is than spending hours each week, slaving over spreadsheets to get the answers you’re looking for. That’s why we created this platform. We were sick and tired of “spreadsheet hell” ourselves.
FunnelDash truly is the ultimate Facebook ads client account management resource. You’ll save time, money and stress by adding it to your agency tool box.
Click on the button below to get your free 14-day trial now.
How Do You Use FunnelDash to Manage Your Clients’ Campaigns?
If you’ve been using FunnelDash, use the comments to tell us how you use it to track and manage your clients’ campaigns. If you’re brand new to FunnelDash, tell us what about FunnelDash grabs your attention the first time you log in.
We may feature you in a future blog post.


