Up until the advent of the Facebook blueprint, there weren’t any resources besides third party info products to tell you how to run ads…
And even today because of how the Facebook interface is setup up there’s so little clarity on why certain ads are working, and others aren’t? What demographics are actually working? What audiences are working? You get the idea.
Facebook doesn’t even provide return on adspend metrics in the native interface.
Luckily there’s another way.

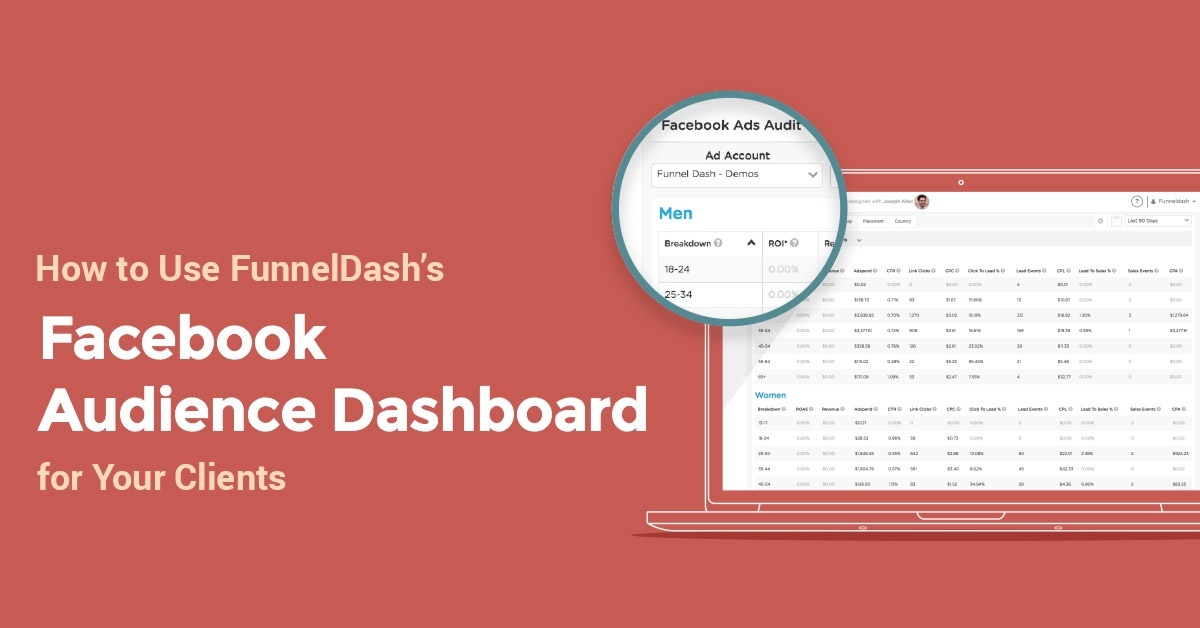
With FunnelDash’s Facebook Audience Audit dashboard (co-designed by yours truly), you can simplify the process of answering questions like:
- What are my best performing demographics?
- What is the historic ROAS of my adspend?
- What are the best performing hours of the day?
- What are my best audiences?
- What are are the best demographics for a particular audience?
- What are my best performing countries?
Before FunnelDash, getting the answers to these questions and more either involved a time consuming process of naming every single adset with the audience name and presegmenting every audience, noting down the results for each filter, or pulling complicated pivot tables with custom fields and delimiters in Excel…
Then you had to attempt to clean up the data in a way that your spreadsheet-phobic clients could digest.
Now it’s as simple as logging into FunnelDash, connecting your client’s Facebook ads account, and going over to the Facebook Ads Audit Dashboard to get the answers your client is looking for.
Whether you’re an agency running Facebook ads for clients, or you’re doing it for your own company, here’s a rundown on how to use the Facebook Ads Audit Dashboard to scale your campaigns.
Getting to the Table Breakdowns
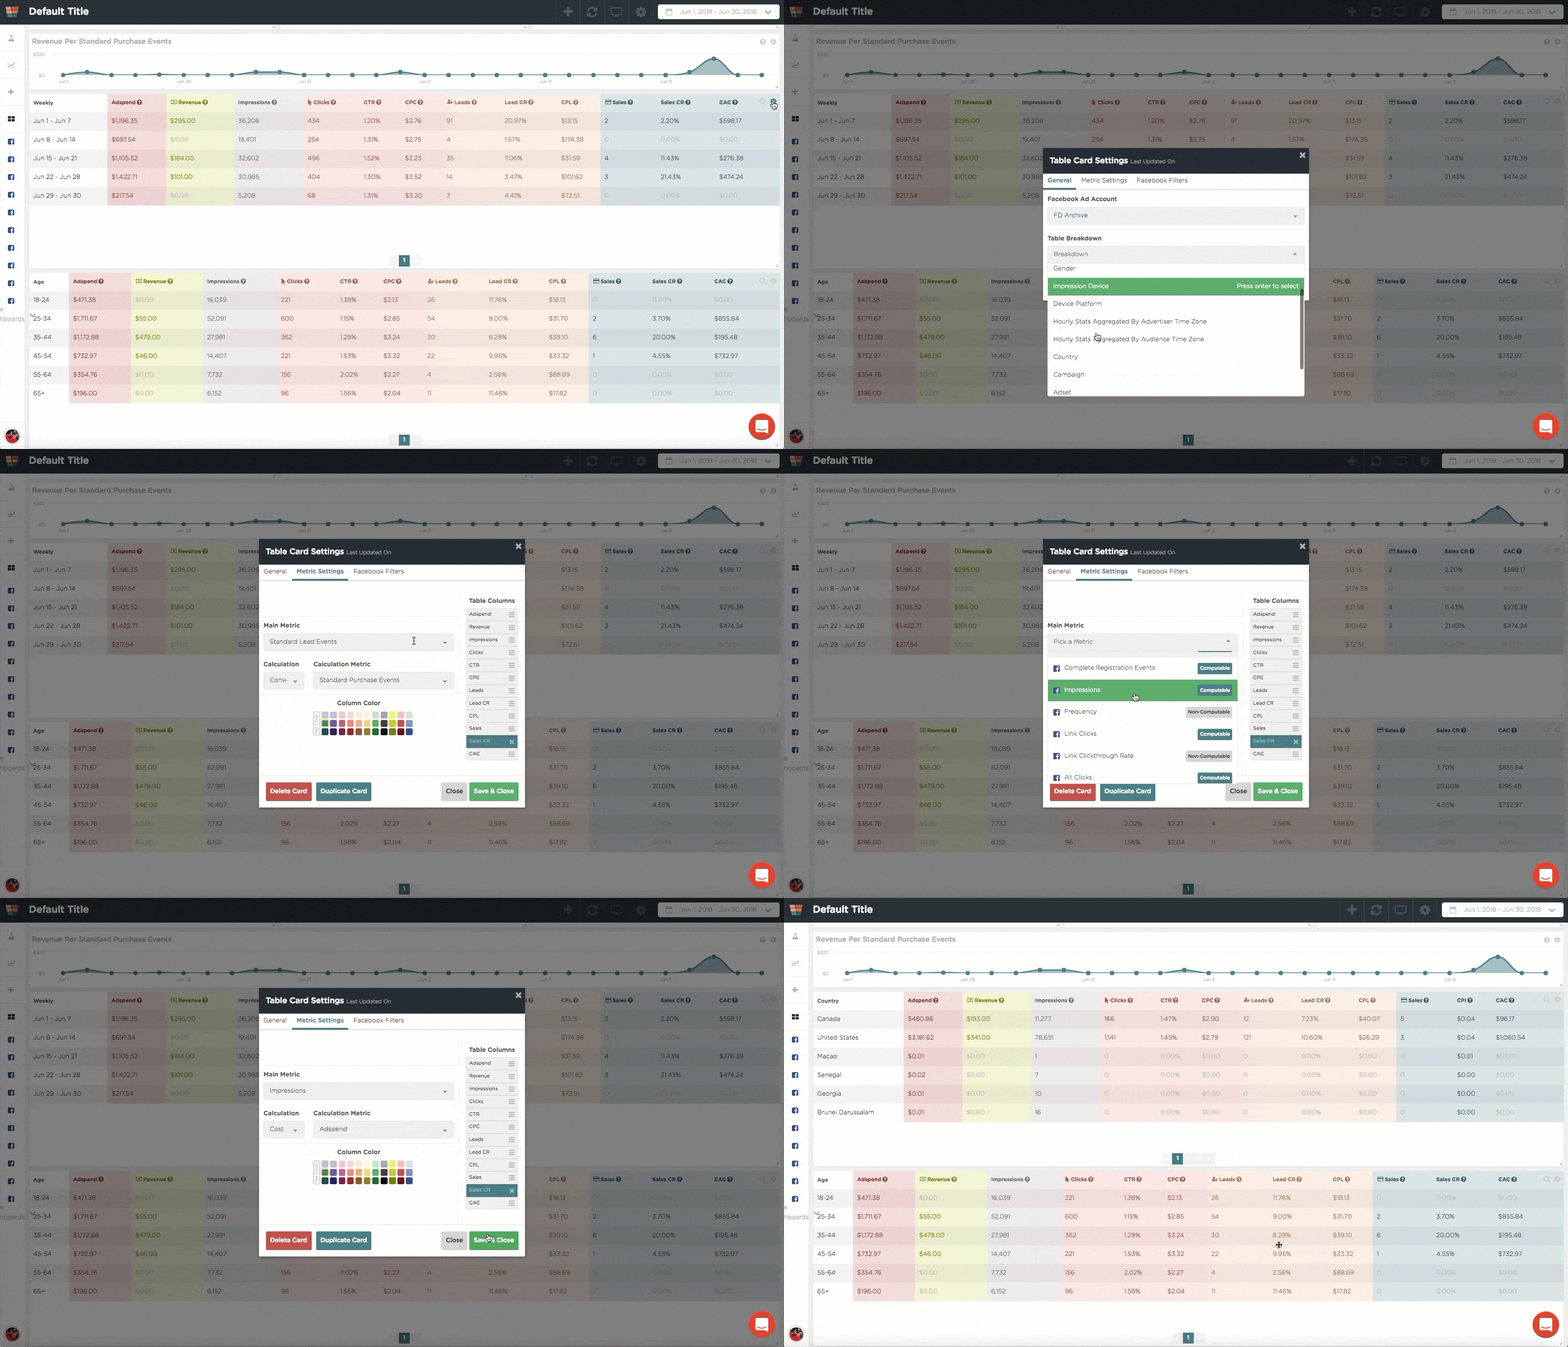
FunnelDash will break down your client’s data for you by:
- Week
- Age
- Gender
- Impression Device
- Device Platform
- Hourly Stats Aggregated by Advertiser Time Zone
- Hourly Stats Aggregated by Audience Time Zone
- Country
- Campaign
- Ad Set
- Ad
- Product ID
To do this, click on the gear icon at the far right of the table on the Facebook Audience Audit dashboard. Once the Table Card Settings box comes up, you’ll be able to change the breakdown you’re viewing in the table. This is also where you can change the metrics that appear in the table.

Demographic Breakdowns
We’ll start with Age and Gender.
Your table will automatically set to view conversions. If it isn’t, make sure the conversions you want to track are added in the Metrics section.
(Side note: If you’re not bidding for conversions for cold traffic/prospecting, you should be.)
For clients who are lower spending advertisers (less than 10k per month ballpark), I’d reccomend looking at the last 90 days of spend, leads, sales, revenue and ROAS. Make your decisions on what demographics to include based on your aggregate conversion objective stats. Here are a couple of examples:
Use Case 1:
Advertiser finds that after targeting men 25+, only men 45+ have bought. Moving foward this advertiser can duplicate any existing adsets that have fallen off or under-performed, and re-upload the campaign with the revised age targeting.
This advertiser should also limit the age targeting of men to 45+ for new audiences.
Use Case 2:
Advertiser finds that sales for women 25-34 are way below the target CPA. Women 35-44,45-54, and 55-64 have all had sales of relatively the same CPA. Advertiser should split out new audiences based on these lines.
Identify Profitable Placements
The next breakdown you’ll want to look at to grade your historical campaign performance is Device Platform.
Again, sort by conversion objective campaigns for the last 90 days, and take note of your spend, ROAS, CPL, and CPA for each of the active placements.
These days, Facebook automatically selects all placements for new adsets. If you’re auditing a client’s account, it will become apparent very quickly if that’s what they’ve been doing.
Use Case 1:
In many of my client audits, I’ve found inefficient ad spend because “all placements” was selected on the ad set level, and either the Instagram or Audience Network wasn’t converting.
As a rule of thumb Instagram should have its own creative and targeting, and should be separated into its own campaign.
Use Case 2:
If you find that mobile is performing poorly vs desktop, you need to dig deeper into your data. 80% of Facebook’s traffic is mobile, so unless your pages aren’t mobile responsive, it’s more likely that certain segments of your mobile traffic aren’t working.
Fortunately, FunnelDash can help you do that…
Digging Into Device Data
In the “Impression Device” breakdown, you’ll find conversion and spend data for every device that your ads were served on.
What I often find when digging through mobile ROAS and CPA by device is:
A) No Mobile Devices convert. This is most likely an issue with how your client’s landing page renders.
B) You find tablets perform much worse or much better than mobile phones
C) You find that a particular type of mobile phone converts much better.
If A is the case, go back to your client’s developer or landing page builder, and fix the page rendering.
If B is the case, you’ll want to either exclude tablets from your targeting or group them into a separate adset, with much larger audiences (tablet traffic on Facebook is minimal).
If C is the case, simply limit your mobile feed targeting to iPhone or Android. It’s somewhat of a truism that iPhone traffic performs better than Android, because their user base is more affluent. (Forbes did a great article on the demographics of iphone users in the past.)
The Other Useful Breakdowns: Hour Of The Day and Country (For Higher Spending Advertisers )
These last three breakdowns in the Facebook Ads Audit Dashboard detail your client’s ad performance by hour of day based on your location, or your client’s audience’s location, and by country.
If your client is spending six figures or more per month on Facebook ads, you may want to think about switching their prospecting campaigns to lifetime budgets and using this “Hour Of The Day” info to daypart on the ad set level.
Dayparting is the process of limiting the delivery of your ads to certain hours of the day. For example, if your client is a lead-gen advertiser and you find that certain hours of the day net you no sales, or a high CPL, you can exclude those hours of the day, and typically, you’ll see a boost in performance.
The last breakdown to take note of is the country performance tab. For business owners who sell around the world, and group many countries into the same targeting, you’ll want to take note of the differences in performance by location.
For smaller countries that perform well with 1% lookalike audiences, try expanding to 5% nested (5% excluding 1%), or 10% nested.
For countries that don’t perform, exclude them from future targeting.
For countries that get conversions, but convert at too high a cost, there may be a creative mismatch issue.
In many instances, when you group a set of countries together, and test different creatives to that group, one piece of creative that performs for one country may not perform for another. In this case, you’ll want to re-upload your campaigns with separate targeting for that specific country.
Prioritize Your Segments And Avoid Over-Segmenting
We designed the Facebook Ads Audit Dashboards to help you identify highly efficient and inefficient segments of your clients’ traffic. There is one important caveat to remember before you start segmenting every one of their audiences by age, gender, location, placement, and device;
On Facebook, there is many times an inverse relationship between cost and audience size.
In other words, you’ll need to balance audience size of your segments with the data you now know about how those segments perform.
For clients who are lower spending advertisers, you’ll want to eliminate segments with no conversions and pick the #1 highest priority segment you find in your data, whether that’s gender, age, or placement.
For clients who are medium spending advertisers ($20-50k per month), pick your two highest priority segments.
For clients with more niche products and offers, you’ll want to keep your audience sizes 500,000 to 2MM
For clients with products that have a more broad appeal, you’ll be able to bring your audience sizes much higher than that.
Now you should have all the info you need to start improving on your clients’ previous ad spend… Happy segmenting!
FunnelDash Makes Your Job Easier
The worst part of running an agency is when you can’t prove to your clients that you’ve increased their bottom line. Either your clients make changes to their ads without telling you, which screws up your reporting, or they don’t value your hard work.
FunnelDash can help you get new leads for your agency, prove your worth to those potential clients, and more. We’ll show you how during our online training, 4 Brutal Mistakes that Marketing Agencies Make & How to Avoid Them. You’ll see how to increase your clients’ bottom line, and get new clients who will love and respect what you do, right off the bat. Click on the button below to save your seat for the next training.
Have you used the FunnelDash Facebook Audience Audit Dashboard? Tell us what you think in the comments.


