You open up ads manager, you’re digging through your numbers, you notice some of your paused ad sets and ads are now below your CPA goal or ROAS goal.
You ask yourself:
“I wonder how long it actually takes someone to make the decision to buy?”

If you’ve ever asked yourself this question, and wondered how to get an exact answer without digging through your CRM, and comparing contact create dates with purchase dates,
Then you need to use cohort analysis to get answers.
Those of you who have read our previous blog posts, may already be familiar with cohort reports and what they do, but for those who haven’t:
Cohort reports show you how long on average it takes for users who completed one event, to complete another event.
In other words, you can use cohort reports to discover how long it takes leads to buy, and on average, how many buyers you can expect 1 week after the initial optin, 2 weeks later, and so on.
Cohort reports will also tell you when the last buyers come in as well.
Up until recently, to use cohort reports you either had to hire a virtual assistant (VA) to manually create cohorts by logging into your Facebook account every day and looking at the conversion for the 28 days previous, or purchase a third-party software.
But now, with Facebook Analytics, you can access cohorts using data from your standard events.
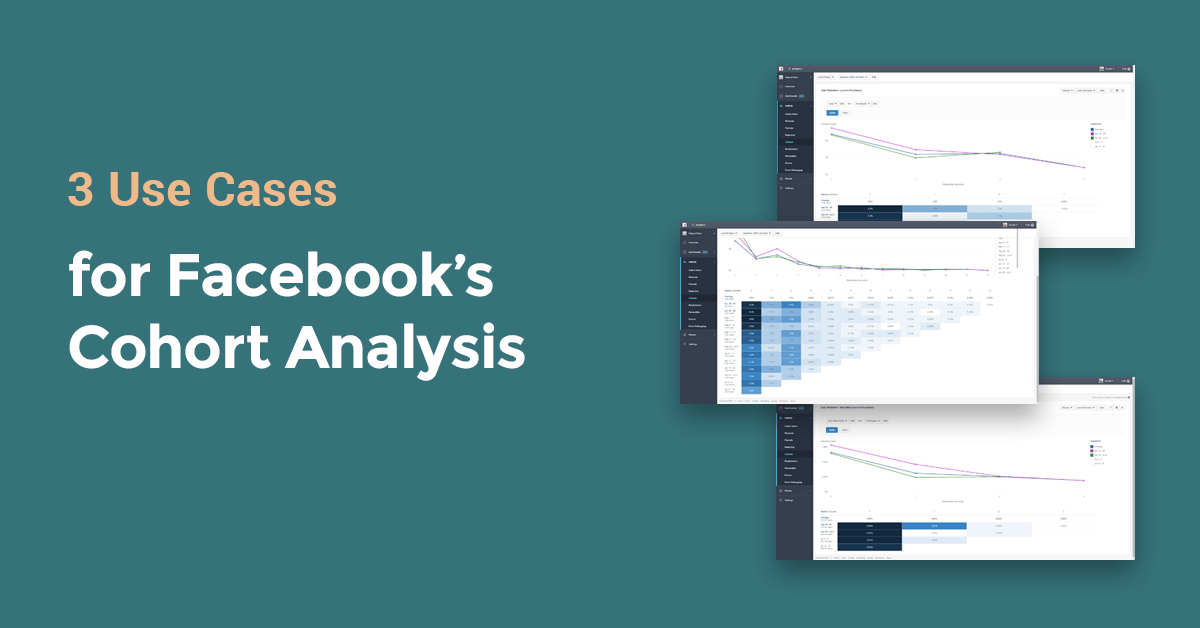
Read on, and we’ll show you three key use cases for Facebook’s Cohort Reports.
Use Case 1: How Long Does It Take My Leads to Buy?
Whether you’re running lead generation campaigns for a global service, or a local business, you NEED to know
How long does it take my leads to buy?
Otherwise you run the risk of turning ad sets off too early (missed opportunity to make $$$), or turning them off too late (wasting ad spend).
To create this cohort report, go to the Analytics link under the “Measure & Report” section in your ad account.
Then scroll to the left and click “Cohort”. You’ll be prompted to choose two events, choose Lead first, then Purchases second.
After clicking apply, you’ll see a screen like this:
 What the bottom table shows, is the percentage of leads that become buyers in the first week after opting in (week 0 on cohort report), and the percentage that become buyers 2, 3, and 4 weeks after the initial optin.
Assuming you’ve had standard events setup for 3 months, you can change the date range at the top left and get even more data. “Okay, but how do I use this information?” You ask.
You use the information in cohorts reports to set KPI benchmarks for your ad sets. Instead of “I pause my ad sets when they’ve spent my target CPA with no sales”, you change your SOPs to, “If the CPA is X after this amount of time, I am at goal or below goal.”
For instance, if I am running a lead generation campaign, and I know that 50% of all sales come in 2 weeks after the initial optin, then I know that my week 0 CPA can actually be double my target amount, because that cohort of users hasn’t matured yet.
Use Case 2: How Long Does It Take Users to Purchase from My Online Store?
This is a similar use case to number 1, but for ecommerce stores, it’s even more pressing of a question.
If you run an online store, and your product isn’t an impulse buy or snap decision purchase, then this is a key piece of information you must know. Personally, I have seen times to purchase for ecommerce stores vary from a couple days, to a couple weeks, to perhaps months or more.
For this cohort, you’ll want to choose “New Web Users” as the first event, and purchase as the second event. Again, the bottom table of this report shows you:
1) On Average, what percentage of your new users bought in the first week post click, vs the second, third and fourth week
2) How cohorts for specific weeks are maturing and where the overall trend of buying behavior is going.
Run this report once every other week and adjust your SOPs accordingly. If you know it takes 1 week for your cohort to mature, don’t look at last 7 days of data, look at the last 7 days of mature data (14 days ago to 8 days ago).
Use Case 3: How Long Does It Take People Who Add to Cart to Purchase?
This is another key piece of information for ecommerce advertisers.
You likely already know that a prospect adding a product to cart is a signal of buying intent,
But knowing how long post-add-to-cart, purchases come in will tell you how to structure your remarketing audiences, and how to structure your cart abandonment email campaigns as well.
Choose “Add To Cart” as your first event, then “Purchases” as your second event.
Note the table at the bottom, and adjust the date at the top to 90 days.
How many weeks pass before “Add To Cart” users stop buying altogether?
When do you see significant drop off in purchases?
Answering these two questions will let you know how recent (what time periods) your add-to-cart remarketing audiences should be, and when to stop advertising to tire-kickers.
Want to Learn How We Do This at FunnelDash?
We’ll show you during our online masterclass, How to Build a 7-Figure Marketing Agency. You’ll see how we use data like this to make more informed decisions about our clients’ campaigns. And how we use it to convert potential clients into happy, paying clients. You’ll walk away knowing how to do this for your own agency, and how you can use these skills to grow your agency to 7-figures and beyond. Click on the button below to save your seat for the next masterclass.
